Polls can be wrong. But the Brexit polls had the race at 50/50 right before the election and that was a pretty good estimate of what happened (1). The Trump/Hillary polls estimated about a 71% chance of Hillary winning and you could argue that the polls were wrong, but that is like arguing that a coin that lands on heads twice in a row must be a double sided coin (2). A 29% thing happened and that is not uncommon (in fact it happens about 29% of the time). Note Hillary did win the popular vote and it’s only through the peculiar electoral college system that the USA has a Larry Davidesque president who threatens to bring “fire and fury, and frankly power the likes of which this world has never seen before” (3).
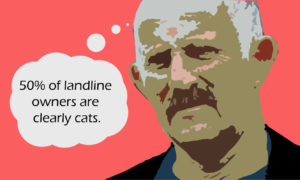
Right now in New Zealand there is a heated election going on and people are debating the validity of the polls. The most common criticism is that many of the major polling organisations use landline phone calling. The average Facebook user or political party leader (TOP I’m looking at you), will say something like “these polls can’t be accurate, only old people use land lines, they’re so biased” (interestingly, everyone thinks the polls are biased against their party (fig.1)). Now one of two things has happened, either you, the average Facebook user, has discovered a bias ruling out the usefulness of polls taken by professional polling organisations whose sole business relies on accurate polls and these million dollar organisations who have professional statisticians with PhD’s in statistics hadn’t considered your brilliant insight, OR these companies know more than the average Facebook user about polling and statistics and they’ve taken steps to address these issues. Two points on why it’s undoubtedly the latter: First, the polls have been very accurate in past elections (4), second, if you read the information on the statistical methods used they mention that these are weighted estimates of voting percentages, which is a statistical technique that adjusts the polling percentages based on the expected voting demographics. Here is a crude example of how this works.
Figure 1: Biased polls’ bias are clearly biased
Statistics (stay with me)
Say in the last election 20% of voters were aged between 18-25, and in your opinion poll only 10% of voters were aged between 18-25. The results of your poll show that 50% of your 18-25 polled people intended to vote TOP and 50% vote Greens, while 40% of your 25+ poll users intended to vote NZ First, and 60% vote National. Your unadjusted poll would come out as:
50% x 10% = 5% TOP
50% x 10% =5 % Greens
40% x 90% = 36% NZ First
60% x 90% = 54% National
Now our land-line study only got 10% of 18-25 age bracket, that was because of bias in the sampling method, but we can account for this by reweighting based on the previous demographics of the last election. And so it would look like this:
50% x 20% = 10% TOP
50% x 20% =10 % Greens
40% x 80% = 32% NZ First
60% x 80% = 48% National
Now you can do these kinds of adjustments using much more sophisticate techniques to include income, ethnicity, gender, age, etc. to limit the bias caused by the sampling method. In short, there are people with PhD’s in statistics who have thought of this simple problem and so much more.
- https://en.wikipedia.org/wiki/Opinion_polling_for_the_United_Kingdom_European_Union_membership_referendum#/media/File:UK_EU_referendum_polling.svg
- https://projects.fivethirtyeight.com/2016-election-forecast/
- http://www.independent.co.uk/news/world/americas/donald-trump-north-korea-fire-and-fury-like-the-world-has-never-seen-nuclear-threat-a7883386.html
- https://en.wikipedia.org/wiki/Opinion_polling_for_the_New_Zealand_general_election,_2014

